This article will introduce one type of diagram, a bubble map. Nowadays, our life and workplace are full of data, ideas, and insights. However, converting them into actions is a big problem since they are abstract and difficult to understand. That makes visualization an essential skill for everyone. Bubble maps are helpful for students, teachers, and professionals to represent information and ideas on any topic in the form of a map. To learn this diagramming, you can read our introduction below.

- Part 1: What Is Bubble Map
- Part 2: Best Bubble Map Examples
- Part 3: How to Make a Bubble Map
- Part 4: FAQs about Bubble Maps
Part 1: What Is Bubble Map
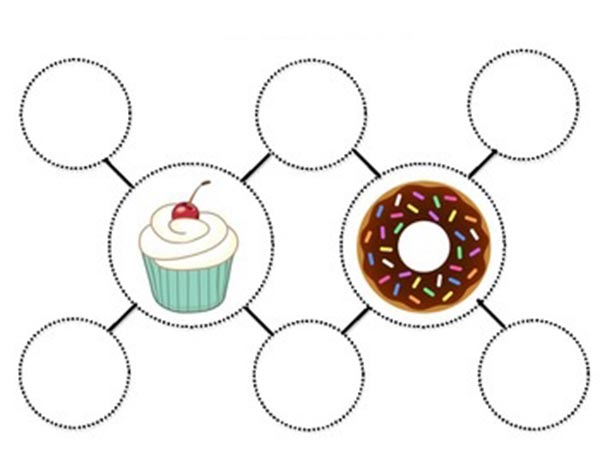
As mentioned previously, a bubble map is a visual diagram or illustration representing information in the form of a map. It is a representation of a noun surrounded by adjectives that can be used to describe and define the main topic. The noun or the main keyword is written in the center of the map inside a large bubble while the relative information is written in smaller bubbles around.
The bubble map is used to describe any topic or subject. The main purposes include:
1. For fiction. You can select a character from a movie, a novel, or a book, and analyze the attributes with the words that would perfectly describe it.
2. For science. Students can use bubble maps to draw a chapter and understand it clearly. Teachers from many subjects use bubble maps to help their students, such as physics, chemistry, biology, and.
3. For concept learning. Some concepts and terms sound abstract, but if you draw them using bubble maps, you will find them easy to understand.
4. For understanding roles. We play a variety of roles in life and work, like marketers, sellers, CEO, CFO, etc. Bubble maps can help others understand these roles exactly and clearly.
5. For brainstorming. Team members or students can collaborate to create a bubble map together. This is a process of brainstorming.
6. For product presentation. Many businesses rely on bubble maps to describe their new products or services. So that clients can learn the attributes or related themes of the product quickly.
Part 2: Best Bubble Map Examples
According to the purpose, bubble maps can be divided into several types. To help you understand them clearly, we display the bubble map examples based on the types below.
1. Character bubble maps. In this example, viewers can get the attributes of a specific character.
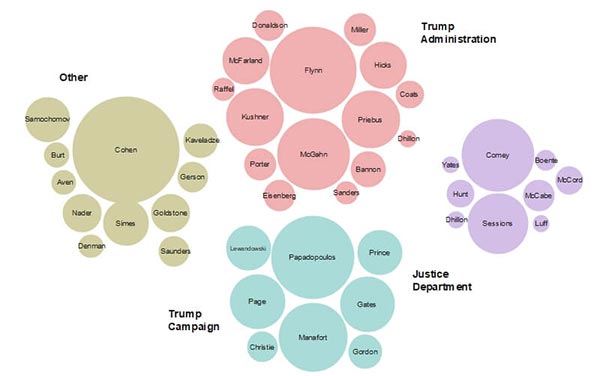
2. Science bubble maps. Bubble maps are excellent learning tools for science students. They use it to depict the relationship between various attributes of an entity.
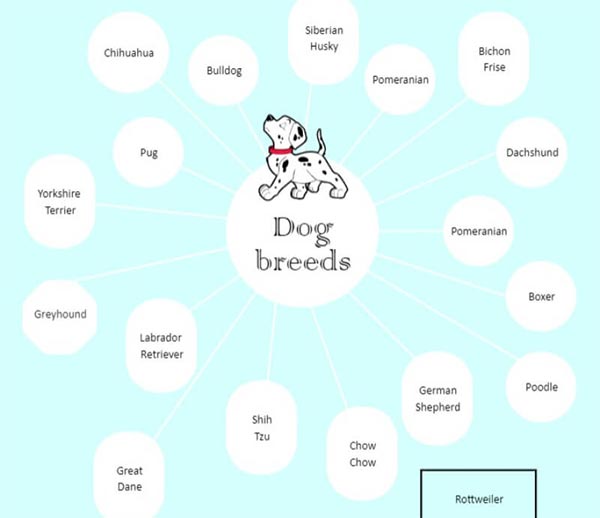
3. Concept bubble maps. We use this kind of bubble thinking map to understand the relationships between concepts and their themes.
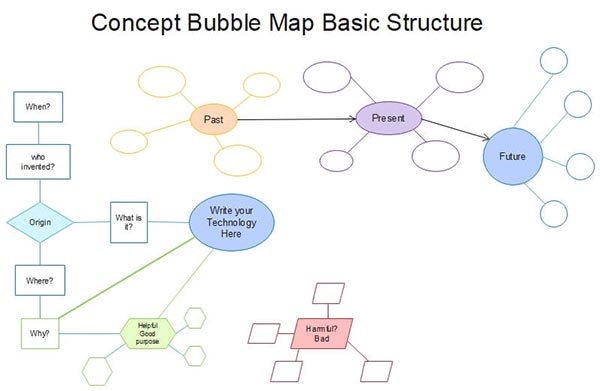
4. Role bubble maps. They describe new roles or some attributes of specific roles. In small businesses and enterprises, stakeholders and all departments can understand the new roles with these bubble maps.
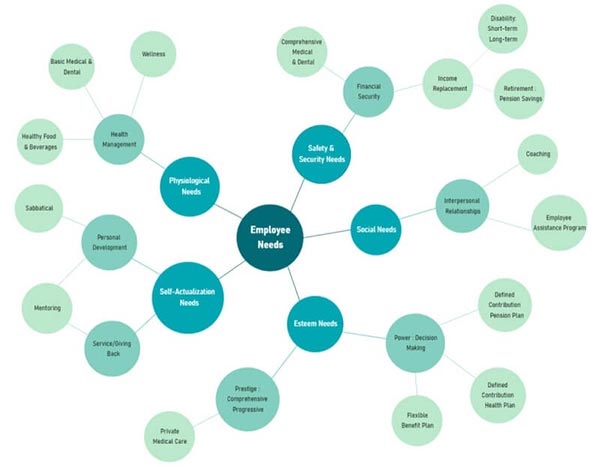
5. Brainstorming bubble maps. This is an important bubble map example. A team or a group can work together to explain an idea or present a term using brainstorming bubble maps.
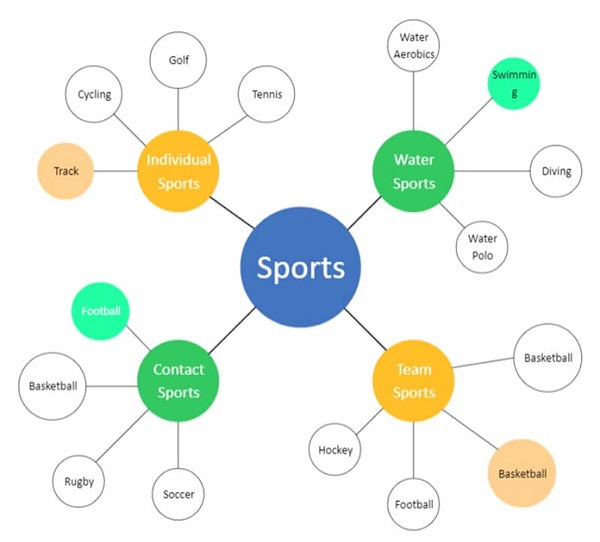
6. Product bubble maps. They help customers to understand a product or service clearly. This is another essential bubble map example for business.
Part 3: How to Make a Bubble Map
Now, you should understand what a bubble map is, but how to make it becomes a new problem. It cannot be denied that you can draw a bubble map using the built-in shapes in MS Word or PowerPoint. However, they lack templates and are not a good choice for beginners.
Fortunately, MindOnMap can meet your need. It is a web-based app that allows you to make bubble maps online without installing any software. Moreover, it is completely free to use with no extra payment. The embedded templates and themes can help you simplify the whole workflow. Here are the basic steps to make a bubble map.
Step 1 Open a web browser, and visit the online bubble map maker. Log in to your account. If you do not have one, create a new account for free.
Step 2 Click the Create Your Mind Map button to open the next page. Then head to the New tab from the left side, and you will see the templates and themes. Select a proper one to enter the editor page.
Step 3 Here you can get the main bubble on the map. Double-click the main bubble, and write down the subject.
Step 4 Locate the top menu bar and select Node to add a node. If you want to change the shape of the node, click and expand the right sidebar, go to the Style tab, and select a shape under the Shape tool. You can also decorate the node with icons and colors. Double-click the node and enter an attribute. Repeat the step to add all nodes and sub-nodes.
Step 5 Click on a bubble and drag it to the proper place. Do the same to other bubbles until you get the perfect layout.
Step 6 At last, click the Export button, and choose an appropriate format to download the map. Or click the Share button to publish the bubble map directly.
Further Reading:Part 4: FAQs about Bubble Maps
Why do we use a bubble map?
The bubble map is specifically used for describing an object.
Is a bubble map a graph?
The bubble map is a multivariable graph that uses bubbles to represent data points in three dimensions.
How do you read a bubble map?
The object that the creator wants to describe in a bubble map is in the center. The attributes are around the object.
Conclusion
This guide has discussed what the bubble map is, the types, the best examples, and how to make a bubble map for beginners. You can follow our introduction to learn it quickly. We have listed the best examples to help you understand bubble maps easily. MindOnMap is the best method to create bubble maps online for free. If you have other questions about this topic, please feel free to leave a message below this post.

